Current Stock Market Valuations

Stock market indexes have had a tremendous run since the lows of October 2022.  The S&P 500 has gained around 60% in less than two years.  The annualized return since that low has been an astonishing 28.5%, far outpacing the historical gain of about 10% per year.   If these returns were the norm, I would have a very easy job. 

The Price/Earnings Ratio, or PE ratio, tells you how much you are paying for each dollar of earnings of a stock or stock market index.  The current PE ratio for expected earnings of the S&P for the next year is about 21.  The chart below shows where that falls over the past 10 years.  We are 8.2% over the five-year average and 17.3% over the ten-year average. 
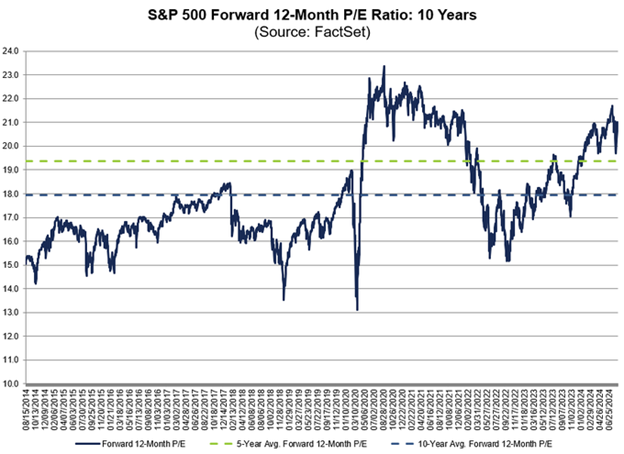
To justify a higher earnings multiple, one of two things have to happen: 

Option 1 is that companies grow their earnings at a greater pace than normal. Earnings growth for the S&P is projected to be 16% by the end of 2025.  Those are lofty expectations as the historical average is around 10%.  A lot of earnings growth is expected from the adoption of Artificial Intelligence, so this very well may happen. 

Option 2 is that the stock market will have subpar returns over the intermediate future.  Currently, the market is justifying its higher than average Price/Earnings ratio because of that higher than expected earnings growth.

I’m not necessarily calling for a stock market crash, but I am being a little cautious.  Long-term time horizons smooth out risk.  Selling out of stocks now with the idea of buying them back at a cheaper price is usually a loser’s game.  Selling appreciated assets also creates capital gains.  Many clients have significant capital gains.  It simply doesn’t make sense to sell your holdings and pay taxes, hoping to buy them back a little lower.  August through October is on average the weakest stretch of the year. That being said, I am taking my time with any new money or cash coming from bonds that normally would be allocated to stocks.  Rest assured, your allocations will soon be where they need to be.  With risk-free government bonds paying around 5%, I just may take some extra getting there.

Generating Income with Covered Calls

As a financial advisor, I am always looking for ways to generate more income for my clients’ portfolios.  Bonds can be great income producing products and are usually quite stable.  The downside of bonds is that they don’t give investors any upside appreciation.  One investment strategy that can give you both growth and income is called a covered call strategy.   Trading options may sound intimidating, but they can be used to cut risk and to generate income in your portfolio.

What is a Covered Call?

A covered call is an options strategy where an investor owns an asset, typically shares of a stock, and sells a call option on that same asset. The call option gives the buyer the right to purchase the underlying asset at a predetermined price within a specified period. In return for selling this call option, the investor receives a premium, which they keep regardless of what happens with the option.

How Does it Work?

Let’s break down the covered call strategy with an example:

Apple stock is trading at $170.  You can sell an option to sell your Apple stock on July 19 for $175.  One option contract is 100 shares of stock.  You would receive $6.50 in premium from selling your option.  That gives you a 3.8% yield for 3 months.

PriceDollars
Buy 100 Shares of Apple17017,000
Sell 1 Contract- 175 Call 6.50650
3 Month Covered Call Yield3.8%

Possible Outcomes

If the price of Apple stock goes lower, your first 3.8% in losses is covered by the premium that you received from selling the option. 

If the price stays around $170, you will receive your 3.8% yield.  

If the stock rises to $175 or above, you may have to sell your shares at $175, even if the stock appreciates well above that $175 price.  Your total return would then be:

$5 appreciation on the stock (175-170) plus the $6.50 in option premium = $11.50.

That makes your 3 month return 6.8%.

Apple Stock Price at ExpirationPercentage MoveGain or Loss $Gain or Loss %
150-11.8%-13.5-7.9
160-5.9%-3.5-2.1
1700.0%+6.5+3.8
175+2.9%+11.5+6.8
185+8.8%11.5+6.8

What Happens after your Option Expires?

What happens after July 19 depends on where your Apple stock is trading as that date arrives.  If the stock remains below $175, you can choose to sell another option at a later date and continue to make this an income generator for your portfolio.  If the stock is trading above $175, you may have the option of buying back that option and rolling it to a further out date and/or price or you could simply sell your shares for $175 for a solid return.

Tax Considerations

Options are subject to the same holding period rules as other investments.  If options are held for more than a year, they are taxed at the long-term capital gains rate, 15%, or 20% for higher earners.  If options are held for less than a year, they are taxed as ordinary income.  There are some covered call funds that use Index Based Options that offer more advantageous tax rates.  They are typically taxed as 60% long-term and 40% short-term.  Covered calls are probably best used in retirement accounts due to their taxation, but also work just fine in taxable accounts.

The Downside of Covered Calls

Like with any other investment, there are risks and consequences to consider:

  1. Limited Upside: By selling a call option, you cap your potential upside if the stock price rises significantly above the strike price.
  2. Limited Downside Protection: In our example, you received a 3.8% yield. If your stock depreciates by more than 3.8%, you will lose money.  

How Can I Use Covered Calls?

This strategy can be used on individual stocks, indexes like the S&P 500, or Exchange Traded Funds (ETFs).  ETFs give you diversification of the underlying asset and, typically, monthly income.  Using individual stocks gives you less diversification but it can give you more options as to how far out in time and price you want to write your option.  This can be very effective for highly appreciated stock that you don’t want to sell for tax purposes, but would like to use to generate more income for your portfolio.

Writing covered calls is not meant to be a replacement for the equity portion of your portfolio, but it can be a great way to increase your income.  The income portion of your portfolio should have a diverse mix of income producing investments, especially as you move into retirement.

If you think that covered call strategies could fit into your portfolio or have any questions, please reach out to me at shawn@smrstrategic.com.

ETFs, and Why They’re Better

ETFs usually have lower fees and more options than traditional mutual funds, while offering more avenues of diversification, opportunity, and far superior tax-loss harvesting options.  This is why I use ETFs and individual securities for my clients.

For most of the 20th century, traditional mutual funds were accepted by investors as the best investment products for building wealth and diversification.  In 1993, a new kid on the block came in and changed the investment landscape forever.  That’s when SPY, the SPDR S&P 500 ETF, was introduced to the world.  Global investment in ETFs now totals nearly $10 trillion.

ETFs are typically more cost effective and tax efficient than their older sibling, mutual funds.  The investments held inside both of these types of funds can be the exact same, but the tax adjusted returns can vary dramatically.  Both funds can buy and sell securities throughout the year that create capital gains or losses within the fund.  With mutual funds, those gains or losses are passed on to the investor in the calendar year that each individual security was sold.  Typically, in December of each year, mutual fund owners will receive their capital gains or losses reports.  These can sometimes be shocking.  In the stock market selloff of 2022, the S&P 500 was down about 18%, yet many mutual fund owners were given large tax bills because investments within the fund were sold in the year 2022. 

When it comes to ETFs, capital gains taxes are only paid when you sell the ETF.  There are no yearly capital gains or losses, like with mutual funds.  You will have capital gains when you sell your ETF, but you will have more options as to when you pay those taxes. You can also possibly find capital losses somewhere else that you can match those off with.  If you hold onto these ETFs until you pass away, you will never have to pay that capital gains tax and your heirs will receive those funds at a stepped-up basis.  Their new cost basis will be the value of the fund on the day that you died.


Tax-Loss Harvesting

Ticker SymbolInvestmentSharesPrice PaidCurrent PriceValueGain/Loss
SPYS&P 500 ETF50300498$24,900$9,900
AAPLApple Stock100130188$18,800$5,800
TAT&T Stock5003117$8,500$-7,000
MSFTMicrosoft Stock50200414$20,700$10,700
XLUUtilities ETF2007360$12,000$-2,600
Total$84,900$16,800

Let’s say that you bought 5 different investments over the past several years.  You may want to sell your SPY ETF, but you would have to pay capital gains taxes on $9,900.  The long-term capital gains rate is 15%, that means that you’d have to pay $1,485 in taxes.  Using a tax-loss harvesting method, you could also sell your AT&T and Utilities stocks that have losses of $7,000 and $2,600 respectively.  You can subtract that $9,600 loss from your $9,900 gain.  You now only have a gain of $300, and owe only $45 in capital gains taxes. ETFs allow for a much better opportunity of using tax-loss harvesting to improve your tax-adjusted returns.

InvestmentGain/LossPotential Tax
SPY$9,900$1,485
T$-7,000$-1,050
XLU$-2,600$-390
Total$300$45

In qualified accounts, such as 401ks and IRAs, the tax-loss harvesting effect is less important because you don’t pay capital gains taxes.  You will have to pay ordinary income taxes on the money when you withdraw it from the account.  You will also have to account for which gains are long-term and which are short-term.  Short-term gains are taxed as ordinary income, but again, ETFs make for easier tax-loss harvesting.

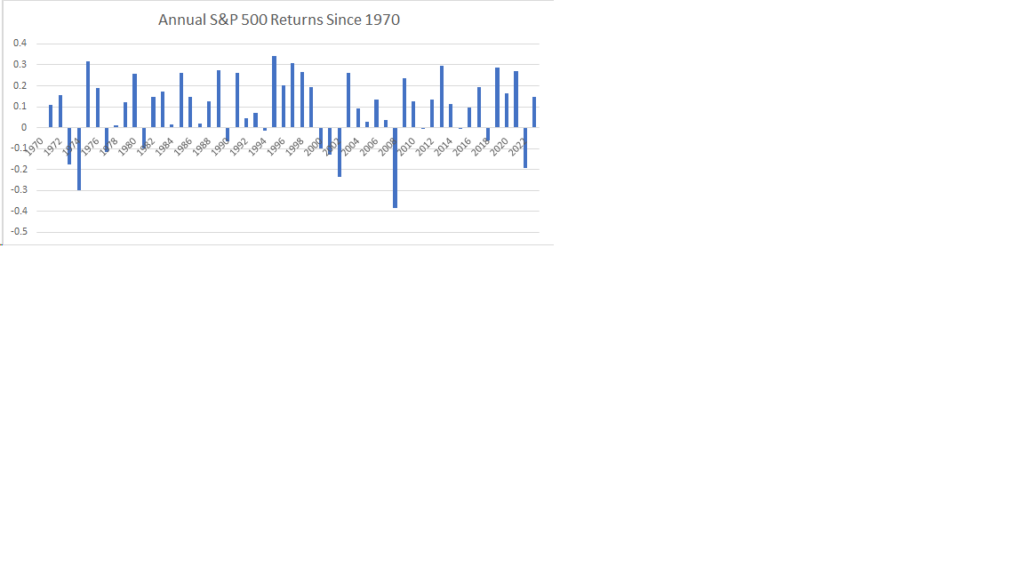
Historical Stock Markets Returns

Since 1929Since 1970Since 2000
Median 10.79%Median 12.35%Median 10.46%
Average 7.45%Average 8.81%Average 6.26%