Current Interest Rates

The Federal Reserve has begun lowering short-term interest rates, as expected.  They started with a 1/2 percent cut and are expected to continue to lower rates through 2025.  Longer-term rates went lower in anticipation of these cuts, but have since gone higher. 

The 10 year US Note had gone below 3.65%, but is now sitting at 4.21%.  This can be attributed to stronger than expected economic data and concerns that neither candidate in next month’s presidential election seems concerned about the federal deficit or debt.

Looking at the data below makes me think that the best value right now is in intermediate and longer-term municipal bonds.  Interest from municipal bonds are typically free from federal taxes.  In almost all states, if you buy bonds in the state that you live, that interest is also not taxed.  I used a 30% total tax rate for the comparisons below, 24% Federal and 6% State.  The higher your income and tax rate, the more valuable that interest free income is worth.


Interest Rates That You Receive

1 Year5 Years10 Years20+ Years
US Government Bonds4.30%
4.07%4.21%4.62%
High Quality Municipal Bonds3.05%3.50%4.15%4.5%
Municipal Bonds- Tax Equivalent4.36%5.00%5.92%6.43%
CDs4.10%3.90%4.05%N/A
High Quality Corporate Bonds4.50%5.00%5.30%5.60%

Interest and Dividends From Funds

High Yield Corporate Bond Fund6.65%
Preferred Stock Fund6.07%
High Quality Dividend Stocks4.25%

Interest Rates That You Have to Pay

30 Year Mortgage6.75%
15 Year Mortgage6.00%
Credit Card APR23.37%

Current Stock Market Valuations

Stock market indexes have had a tremendous run since the lows of October 2022.  The S&P 500 has gained around 60% in less than two years.  The annualized return since that low has been an astonishing 28.5%, far outpacing the historical gain of about 10% per year.   If these returns were the norm, I would have a very easy job. 

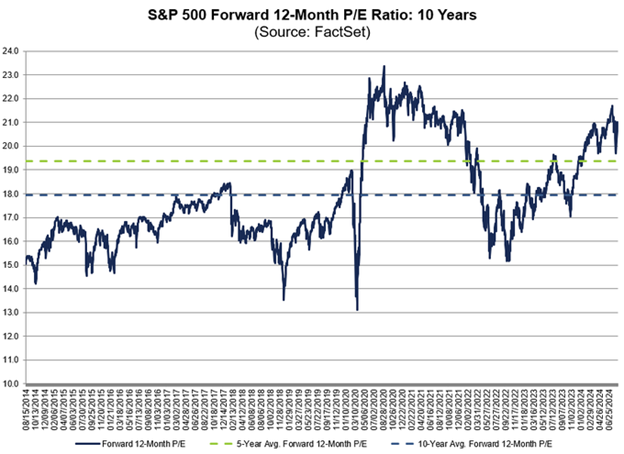
The Price/Earnings Ratio, or PE ratio, tells you how much you are paying for each dollar of earnings of a stock or stock market index.  The current PE ratio for expected earnings of the S&P for the next year is about 21.  The chart below shows where that falls over the past 10 years.  We are 8.2% over the five-year average and 17.3% over the ten-year average. 

To justify a higher earnings multiple, one of two things have to happen: 

Option 1 is that companies grow their earnings at a greater pace than normal. Earnings growth for the S&P is projected to be 16% by the end of 2025.  Those are lofty expectations as the historical average is around 10%.  A lot of earnings growth is expected from the adoption of Artificial Intelligence, so this very well may happen. 

Option 2 is that the stock market will have subpar returns over the intermediate future.  Currently, the market is justifying its higher than average Price/Earnings ratio because of that higher than expected earnings growth.

I’m not necessarily calling for a stock market crash, but I am being a little cautious.  Long-term time horizons smooth out risk.  Selling out of stocks now with the idea of buying them back at a cheaper price is usually a loser’s game.  Selling appreciated assets also creates capital gains.  Many clients have significant capital gains.  It simply doesn’t make sense to sell your holdings and pay taxes, hoping to buy them back a little lower.  August through October is on average the weakest stretch of the year. That being said, I am taking my time with any new money or cash coming from bonds that normally would be allocated to stocks.  Rest assured, your allocations will soon be where they need to be.  With risk-free government bonds paying around 5%, I just may take some extra getting there.

The Case for Individual Bonds

Exchange Traded Funds (ETFs) are fantastic investment products that provide diversification at a relative low cost to investors.  These funds can hold stocks, bonds, real estate, gold, or about any kind of investment you can think of.  I use them for my clients and myself.  However, when it comes to fixed income products there are some important reasons to consider using high grade individual bonds and CDs for your portfolio.

Predictability:

When you buy an individual bond, you know much you’re paying for it, how much it’s paying you, and how much you will receive when the bond is due.  A steady stream of income can be created from several different individual bonds.  This predictability can be particularly valuable for retirees relying on bond income to cover living expenses. 

It is also helpful when you know a large expenditure is coming.  Whether that is buying a house, paying for college, or any large ticket item, individual bonds can take the guess work out of returns.  For example, you can buy a US Government Treasury or CD that comes due right before the date that you need the funds

Less Volatility:

Most bond funds have a target duration or time frame that they want to hold bonds.  For example, the fund may target bonds that come due in about 10 years.  To achieve is, they will usually own a collection of bonds that have 8 to 12 years until they are due.  As time goes by and a bond has less than 8 years left, it will be sold and replaced by a bond that has 10-12 years left.  They then go out and buy the best bonds for their fund.  They are at the mercy of where current interest rates are at the time. This can lead to more inconsistent returns. Most bonds funds that aren’t very short-term funds don’t hold any bonds to maturity.  This isn’t a criticism.  It’s just how those funds work.

The strategy of using individual fixed income products works best using Certificates of Deposit or very high grade bonds, such as United States Government Treasuries and highly rated Municipal and Corporate Bonds.  This greatly reduces risk of default.  When it comes to lower grade and higher yield bonds, diversifying is very important.  That’s why I do use ETFs for higher yield bonds.  That’s when it’s better to pay them a small fee to own hundreds, or thousands, of different bonds from different issuers.

Avoiding Fund Fees and Expenses:

Bond funds typically charge management fees and expenses, which can erode investors’ returns over time. Most of the bond ETFs that I use charge very low fees, but they can add up over the long term, especially in periods of lower interest rates or market volatility. By investing in individual bonds, investors can bypass these fees and improve their overall returns.

Conclusion:

Building a fixed income portfolio is like putting together a puzzle. How much income is needed? How will this income be taxed?  How much risk should I take?  Diversification provided by ETFs is integral, but allocating at least some of your portfolio to individual bonds will take out some of the guesswork when you’re trying to solve your income needs.

ETFs, and Why They’re Better

ETFs usually have lower fees and more options than traditional mutual funds, while offering more avenues of diversification, opportunity, and far superior tax-loss harvesting options.  This is why I use ETFs and individual securities for my clients.

For most of the 20th century, traditional mutual funds were accepted by investors as the best investment products for building wealth and diversification.  In 1993, a new kid on the block came in and changed the investment landscape forever.  That’s when SPY, the SPDR S&P 500 ETF, was introduced to the world.  Global investment in ETFs now totals nearly $10 trillion.

ETFs are typically more cost effective and tax efficient than their older sibling, mutual funds.  The investments held inside both of these types of funds can be the exact same, but the tax adjusted returns can vary dramatically.  Both funds can buy and sell securities throughout the year that create capital gains or losses within the fund.  With mutual funds, those gains or losses are passed on to the investor in the calendar year that each individual security was sold.  Typically, in December of each year, mutual fund owners will receive their capital gains or losses reports.  These can sometimes be shocking.  In the stock market selloff of 2022, the S&P 500 was down about 18%, yet many mutual fund owners were given large tax bills because investments within the fund were sold in the year 2022. 

When it comes to ETFs, capital gains taxes are only paid when you sell the ETF.  There are no yearly capital gains or losses, like with mutual funds.  You will have capital gains when you sell your ETF, but you will have more options as to when you pay those taxes. You can also possibly find capital losses somewhere else that you can match those off with.  If you hold onto these ETFs until you pass away, you will never have to pay that capital gains tax and your heirs will receive those funds at a stepped-up basis.  Their new cost basis will be the value of the fund on the day that you died.


Tax-Loss Harvesting

Ticker SymbolInvestmentSharesPrice PaidCurrent PriceValueGain/Loss
SPYS&P 500 ETF50300498$24,900$9,900
AAPLApple Stock100130188$18,800$5,800
TAT&T Stock5003117$8,500$-7,000
MSFTMicrosoft Stock50200414$20,700$10,700
XLUUtilities ETF2007360$12,000$-2,600
Total$84,900$16,800

Let’s say that you bought 5 different investments over the past several years.  You may want to sell your SPY ETF, but you would have to pay capital gains taxes on $9,900.  The long-term capital gains rate is 15%, that means that you’d have to pay $1,485 in taxes.  Using a tax-loss harvesting method, you could also sell your AT&T and Utilities stocks that have losses of $7,000 and $2,600 respectively.  You can subtract that $9,600 loss from your $9,900 gain.  You now only have a gain of $300, and owe only $45 in capital gains taxes. ETFs allow for a much better opportunity of using tax-loss harvesting to improve your tax-adjusted returns.

InvestmentGain/LossPotential Tax
SPY$9,900$1,485
T$-7,000$-1,050
XLU$-2,600$-390
Total$300$45

In qualified accounts, such as 401ks and IRAs, the tax-loss harvesting effect is less important because you don’t pay capital gains taxes.  You will have to pay ordinary income taxes on the money when you withdraw it from the account.  You will also have to account for which gains are long-term and which are short-term.  Short-term gains are taxed as ordinary income, but again, ETFs make for easier tax-loss harvesting.

2024 Federal Income Tax Brackets

income-tax-4097292_1280

The IRS has released the changes to federal income tax brackets for 2024.  Each year, Tax Brackets, Standard Deductions, and Annual Gift Exclusions are adjusted for inflation, as well as many other IRS tax provisions.  All investment and financial planning advice that I give takes taxes into consideration.

2024 Federal Income Tax Brackets

Keep in mind that these tax rates are for federal income only.  State and local taxes are not included in these numbers. 

Tax RateSinglesMarried Filing JointlyHead of Household
10%$0 to $11,600$0 to $23,200$0 to $16,500
12%$11,600 to $47,150$23,200 to $94,300$16,550 to $63,100
22%$47,150 to $100,525$94,300 to $201,050$63,100 to $100,500
24%$100,525 to $191,950$201,050 to $383,900$100,500 to $191,950
32%$191,950 to $243,725$383,900 to $487,450$191,950 to $243,700
35%$243,725 to $609,350$487,450 to $731,200$243,700 to $609,350
37%$609,350 and up$731,200 and up$609,350 and up

Standard Deduction

The standard deduction for 2024 will increase.  For joint filers, the deduction will increase by $1,500.  For single filers, that increase is $750.  For those 65 and older, there is an additional standard deduction of $1,550 for joint filers and $1,950 for single filers.

Filing StatusDeduction Amount
Single$14,600
Married Filing Jointly$29,200
Head of Household$21,900

Annual Gift Exclusion

The Annual Gift Exclusion for 2024 is $18,000, up from $17,000 in 2023.  This means that the first $18,000 that you gift to anybody is excluded from taxes.  Gifts above that amount can be given, but anything above $18,000 per person would be applied to the Lifetime Exclusion of the person giving the gift.  These amounts are per person, so a married couple can give $36,000 to anybody, free of taxes.  The Lifetime Exclusion for 2024 is $13,610,000 per person in 2024.

Smart Money, Bright Futures: Your College Savings Playbook

Saving for college can be intimidating.  We know that we’re going to have a large expenditure coming up, but we don’t know how much.  Where will they go to college?  How much will it cost?  College tuition inflation averaged 4.63% annually from 2010 to 2020.  Since 2019, the price of tuition, fees, and room and board has been rather flat, and actually lower in some cases.  I don’t think that we should plan for that to continue.  I have included a list of a few college tuition rates at the end as a guide.

There are several different ways to save for college.  I’m going to narrow this article down to 529s and Direct Payments.  Under most circumstances, they will be the best options.

529 College Savings Plans

529 plans are fantastic tools that are designed specifically for college savings.  Earnings grow tax-free and withdrawals for qualified education expenses are also tax-free.  Qualified expenses are tuition, fees, books, supplies, and equipment.  Room and board can also be included in many cases. 

The owner of the 529 account is often a parent or family member of the beneficiary.  The beneficiary of the account can also be changed, so if one child doesn’t go to college or doesn’t use all of the funds in the account, you can change the beneficiary of the account can be changed to a different child, as long as the new beneficiary is in the same generation as the original beneficiary.  A student can also be a beneficiary of multiple 529 accounts.

Gifting Ideas for 529s

Annual Limit SingleAnnual Limit Couples5 Year Front-Load Single5 Year Front-Load Couple
$17,000$34,000$85,000$170,000

A contributor can give up to the annual gift exclusion amount each year without incurring a gift tax.  In 2023, that amount is $17,000 per person.  That $17,000 limit is per person, so a married couple can give up to $34,000 per year without incurring any gift tax liability.  Another unique feature of 529 contributions is that a contributor can give up to 5 years worth of the annual gift exclusion amount without incurring gift taxes.  The IRS will treat each year as 1/5 of the contribution per year.  So, a contributor in 2023 can give $85,000 ($17,000 x 5) to any 529 beneficiary that they wish.  A married couple can double that number to $170,000.  They would then not be able to give that beneficiary any gifts for the next four years without incurring a gift tax penalty.  Any amount given over the annual gift exclusion ($17,000) can be applied to the contributor’s lifetime exclusion, currently $12.92 million per person.

Contributions to 529 plans are not federally tax deductible.  They can be deductible at the state level in some cases, but that depends upon the state.

If funds are not used for qualified education purposes, any distributions will be treated as ordinary income, and possibly incur a 10% penalty as well.  Beginning in 2024, up to $35,000 can be rolled over a lifetime from a 529 to a Roth IRA tax-free, but there are some restrictions.  This does help a little for those that are concerned about overfunding a 529 and potentially having to pay taxes later.

Direct Payments

You can pay for anybody’s tuition or medical expenses directly without it counting toward your annual or lifetime gift exclusion.  Yes, you read that correctly.  As long as the payment is made directly to an accredited educational institution, that gift is never applied to any of your exclusions.  This is the most tax efficient way of gifting for college and reducing the size of your estate.  Do not write a check to the student or their parents.  The payment HAS to be made directly to the institution.

Investment Allocations

Since we know when we’re going to start withdrawing money from the account, we can thoughtfully plan our investment allocations.  When the child is a baby or toddler, we can be more aggressive.  The reason being that the longer time frame, the longer we have to make up losses in the event of a market decline.  Stocks have traditionally outperformed bonds over longer time horizons, but typically bring more risk.  This is the standard allocation for the Schwab 529 Education Savings Plan.  Portfolios are not one-size-fits-all, but this is good information to keep in mind.

Stock Allocation of Age-Based Tracks

Age of StudentAggressiveModerately AggressiveModerateModerately Conservative
4 and Younger95%80%60%40%
5-780%70%60%40%
8-1070%60%50%40%
11-1360%50%40%30%
14-1550%40%30%20%
16-1740%30%20%10%
18-1930%20%10%0%
20+20%10%0%0%

As you can see, allocations to stocks should decline as you get closer to paying those tuition bills, regardless of how much risk you are willing to take.  Remember that this is just a guide.  Speak to your advisor about what kind of allocations are right for you.

FAFSA

The Free Application for Federal Student Aid (FAFSA) is used to determine a student’s eligibility for financial aid.  It takes into account the assets and income of the child and their parents.  Income is more important than assets in this calculation.  The student’s assets and income have a higher weighting than their parents.  This make 529s a better option than trusts, because 529s are typically owned by a parent or grandparent, while a trust is often owned by the student.

Visit this website to get an idea of how much aid a student may receive.

https://studentaid.gov/aid-estimator/

Tuition, Fees, and Room and Board

CollegeIn-StateOut-of-State
University of Illinois$40,000$62,000
Indiana University$29,000$57,000
UCLA$39,000$71,000
Harvard$57,000$57,000
Vassar College$85,000$85,000
Northwestern University$88,000$88,000

These numbers all come from the websites of the prospective schools.  Total expenses for a four-year school can cost well over $100,000.  Saving $4,000 a year for 15 years at a 6% return would bring the account value to $93,000.  With some planning and consistent additions to a 529 account, college savings can be more manageable.  The sooner that you start saving, the less stress you’ll have when your child starts filling out college applications and touring schools.

If you have any questions, please email me at shawn@smrstrategic.com.

2023 Federal Income Tax Brackets

Tax RateSingleMarried Filing JointlyHead of Household
10%$0 - $11,0000$0 - $22,000$0 - $15,700
12%$11,000 - $44,725$22,000 - $89,450$15,700 - $59,850
22%$44,725 - $95,375$89,450 - $190,750$59,850 - $95,350
24%$95,375 - $182,100$190,750 - $364,200$95,350 - $182,100
32%$182,100 - $231,250$364,200 - $462,500$182,100 - $231,250
35%$231,250 - $578,125$462,500 - $693,750$231,250 - $578,100
37%$578,125 or more$693,750 or more$578,100 or more